F5 Distributed Cloud > F5 Distributed Cloud: Discovering & Securing API’s Source | Edit on
Lab 7: API Discovery Using the BIG-IP Connector
Scenario
In this lab, you will explore how F5 Distributed Cloud integrates with BIG-IP LTM to provide API discovery, visibility, and observability for applications running in customer-managed environments. You will be working within a dedicated, read-only namespace in the Distributed Cloud Console. This environment has already been configured with a BIG-IP Connector that is securely connected to a BIG-IP LTM instance deployed in the cloud. The BIG-IP system is actively handling application traffic and exporting telemetry to Distributed Cloud services.
Lab Objectives
By completing this lab, you will learn how to: - Navigate the Distributed Cloud Console and locate API discovery features
Identify API services discovered from traffic flowing through BIG-IP LTM
Review automatically generated API endpoints, methods, and schemas
Examine metrics and logs associated with discovered API traffic
Understand how BIG-IP telemetry enables API visibility without application changes
Expected Lab Time: 15 minutes
Task 1: Review Customer Edge (CE) Infrastructure
For the remainder of this lab, you will work from a shared Namespace where students have read-only access.
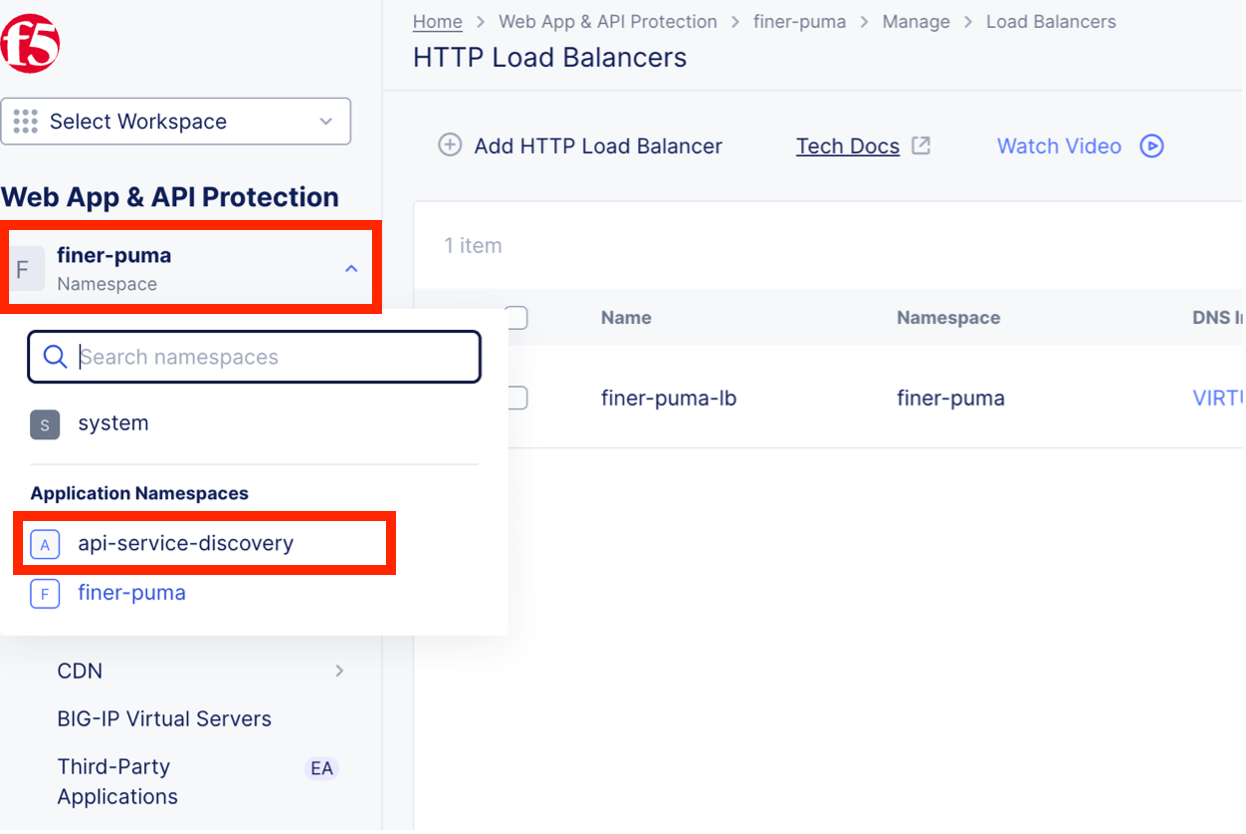
From the Web App & API Protection workspace, click the Namespace drop-down and select “api-service-discovery”
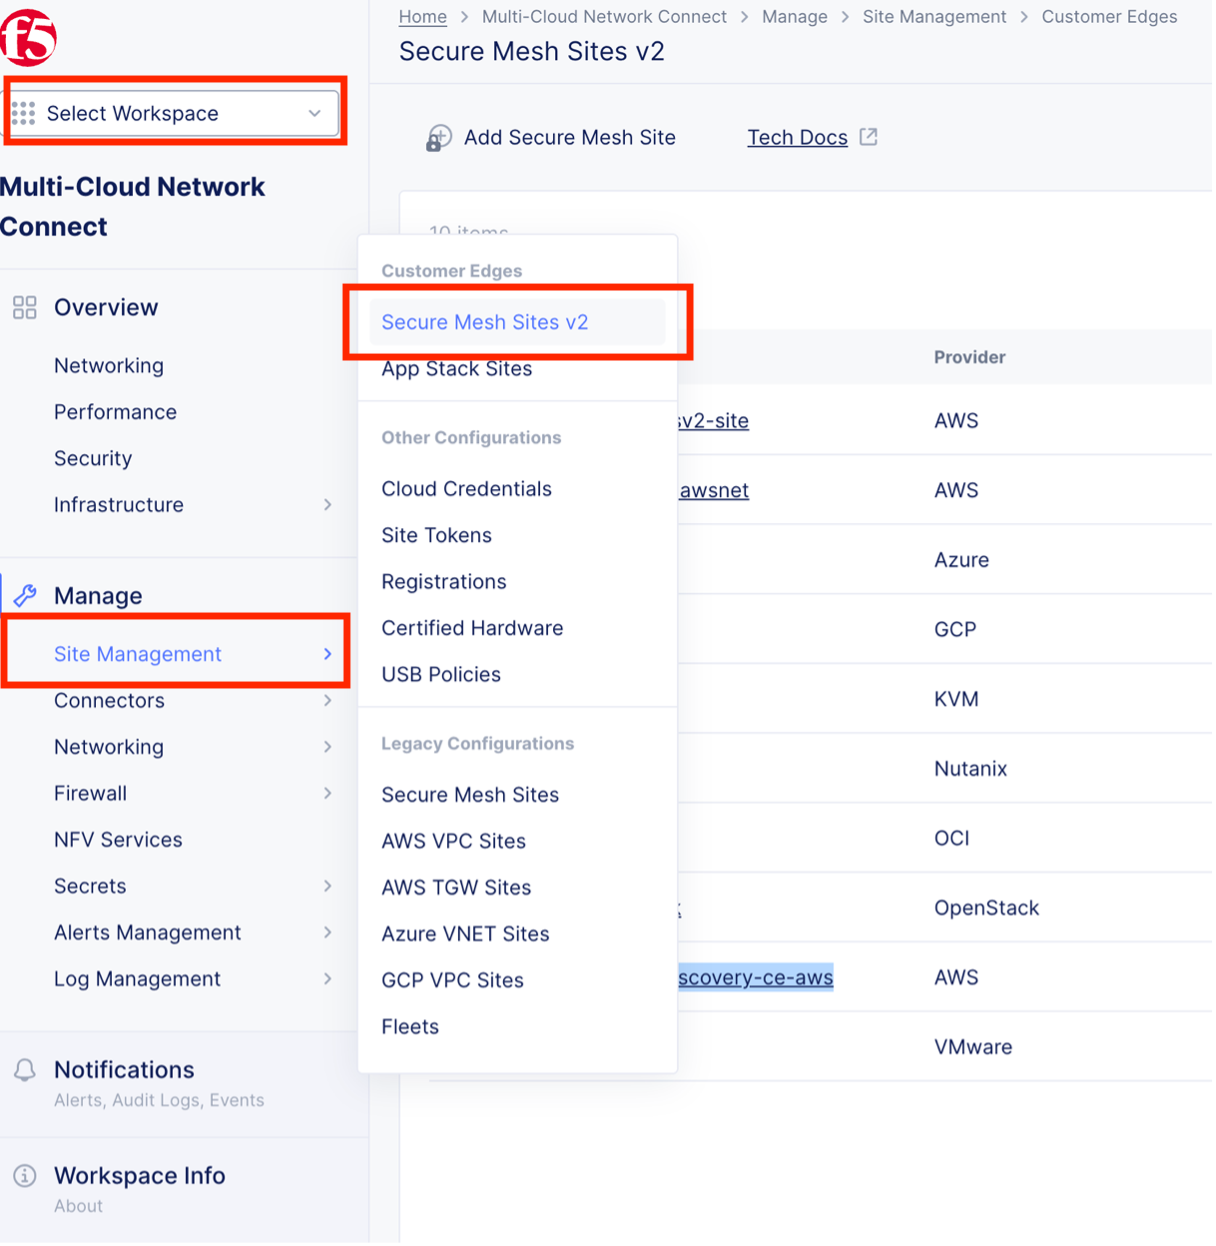
From the Workspace drop-down, select Multi-Cloud Network Connect and then Manage > Site Management > Secure Mesh Site v2
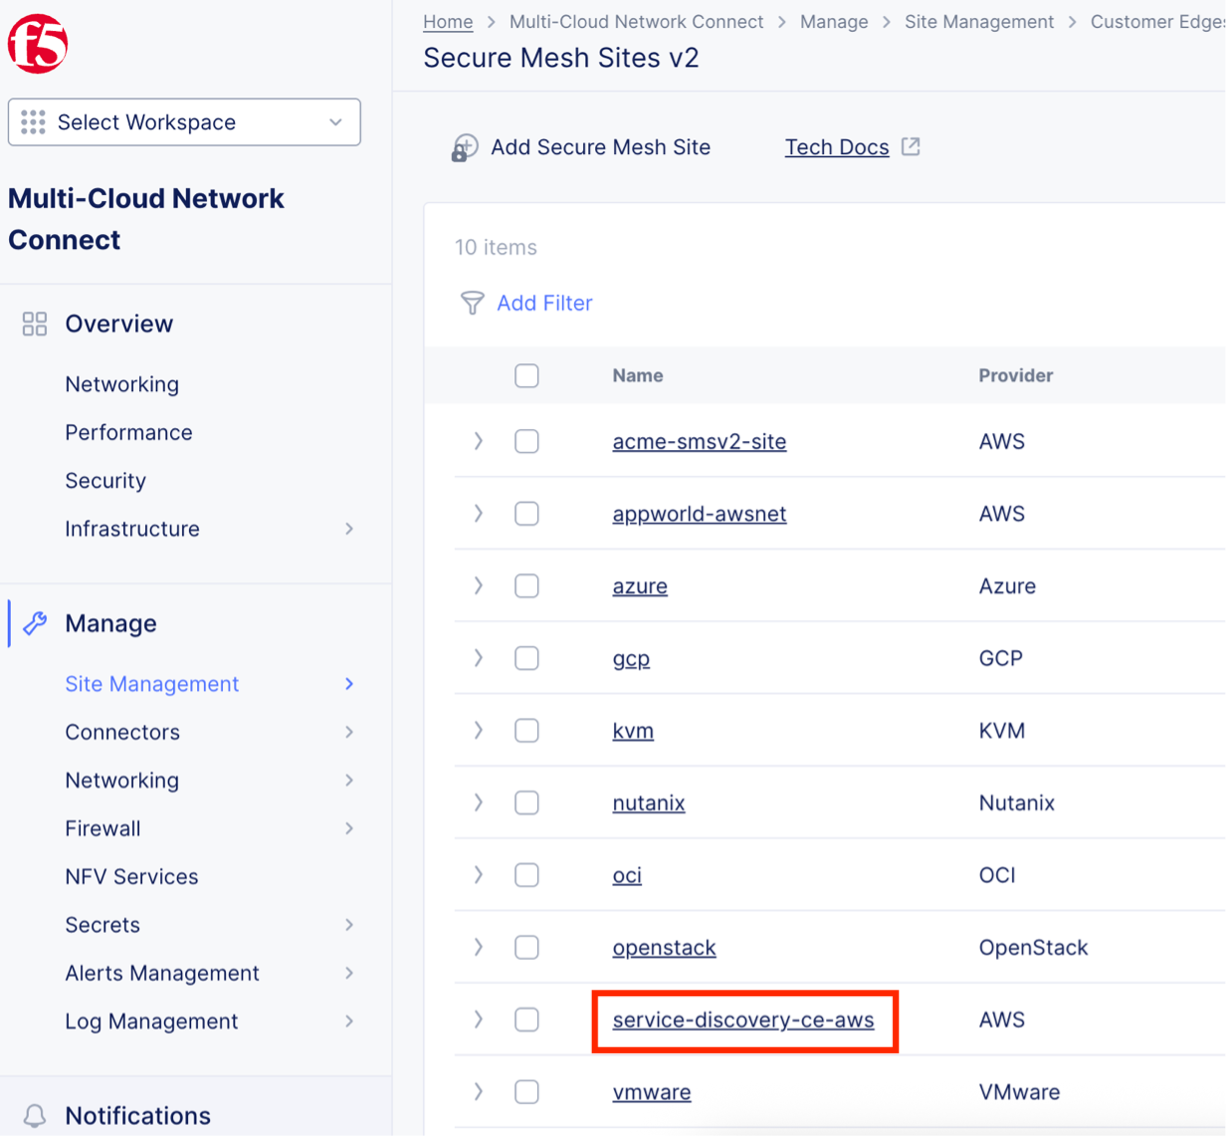
Click on the “service-discovery-ce-aws” site. This CE is used as a telemetry collector for discovered API services on the BIG-IP.
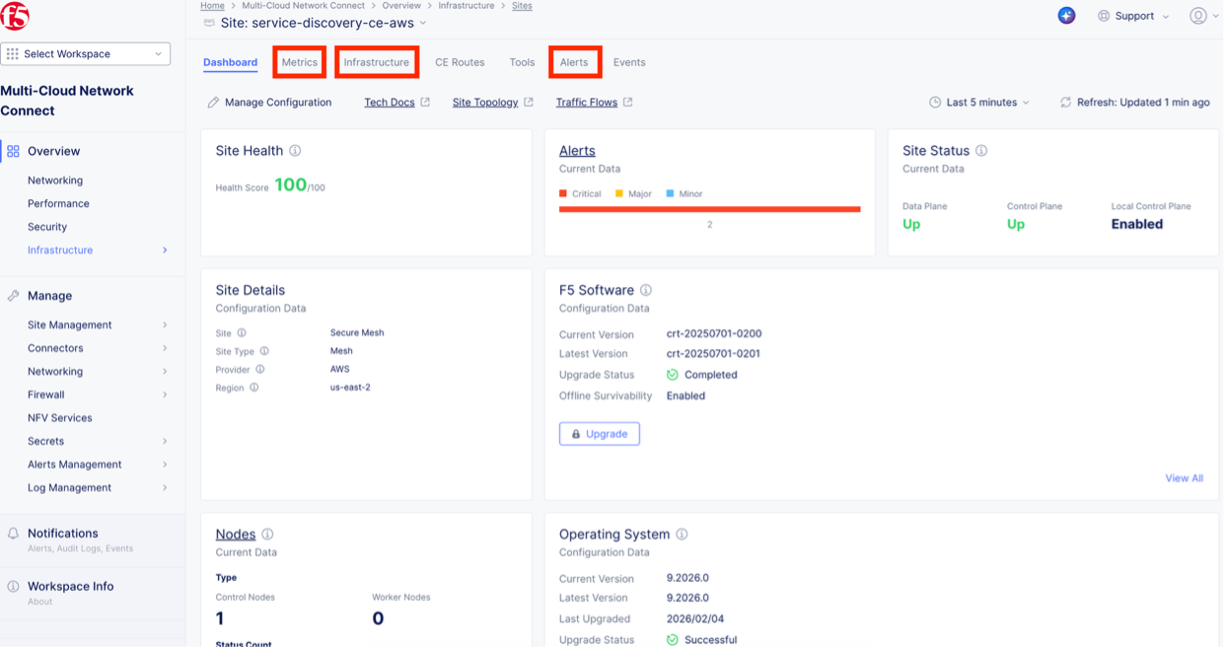
At the top, review the Metrics, Infrastructure and Alerts sections and answer the questions below:
Question 1: What Regional Edges (RE) are the Customer Edge (CE) connected to? Question 2: What are the INSIDE and OUTSIDE IP addresses for this CE? Question 3: Are there any alerts?
Review and explore the related request events. Expand various requests to understand if they were successful or denied.
Continue to explore various filters, events, etc. within the Requests dashboard to review and explore the related events.
Task 2: Review BIG-IP Connector Service
This configuration brings the discovered services into the Distributed Cloud console.
In the Distributed Cloud console, click Workspace > Multi-Cloud App Connect. Expand “Manage” and click “Service Discoveries.” Click “BIG-IP” at the top and you should see one discovered BIG-IP named “api-sd-bip” and it should have “1 Service” associated with it.
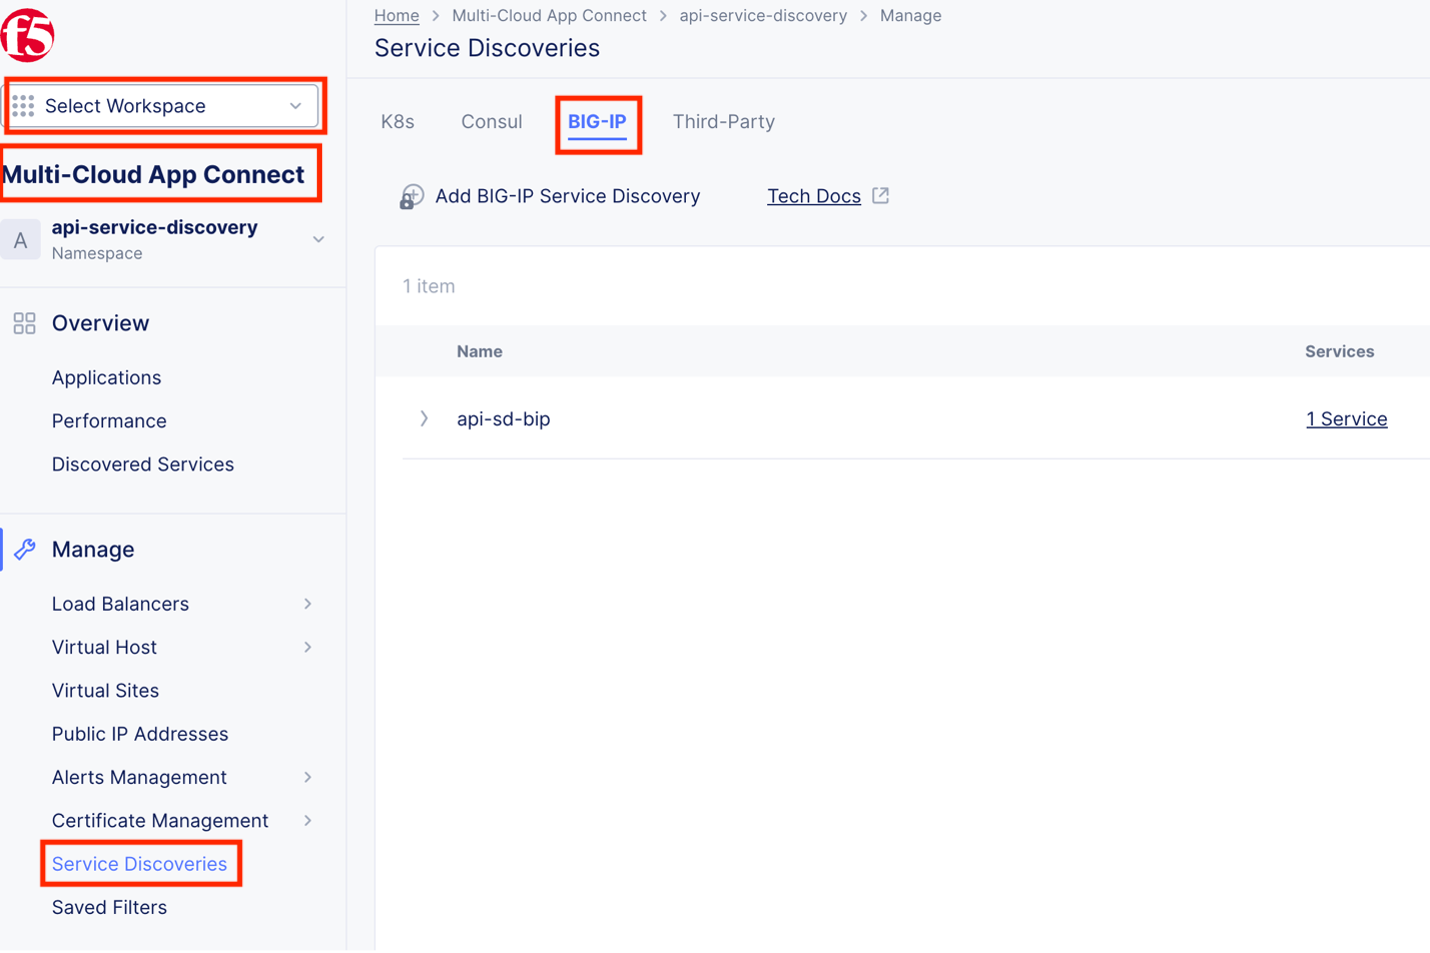
Under the “Services” column click the “1 Service” link to view the discovered API service running on your BIG-IP. You should see the virtual server for the fastapi-httbin app. (Note: This virtual server is running in the local BIG-IP and therefore is not managed directly from Distributed Cloud console. However, we can gain visibility into the traffic being processed by the BIG-IP.
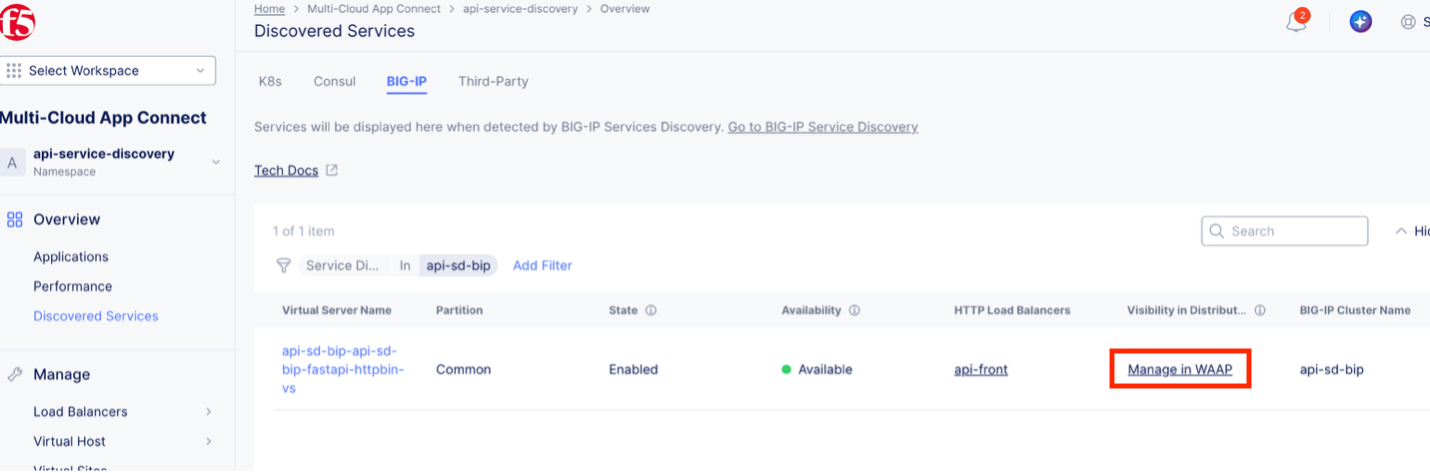
Under the “Visibility” column, click the “Manage in WAAP” link. This will bring us to the Web App & API Protection workspace where you will review metrics about the discovered API service in Task 4.
Task 3: Review Discovered API Service
You should now be in the Web App & API Protection workspace. On the left, click on BIG-IP Virtual Servers. This will give us a list of all discovered virtual servers running on the BIG-IP. For this lab, there is only one virtual server for the httpbin API.
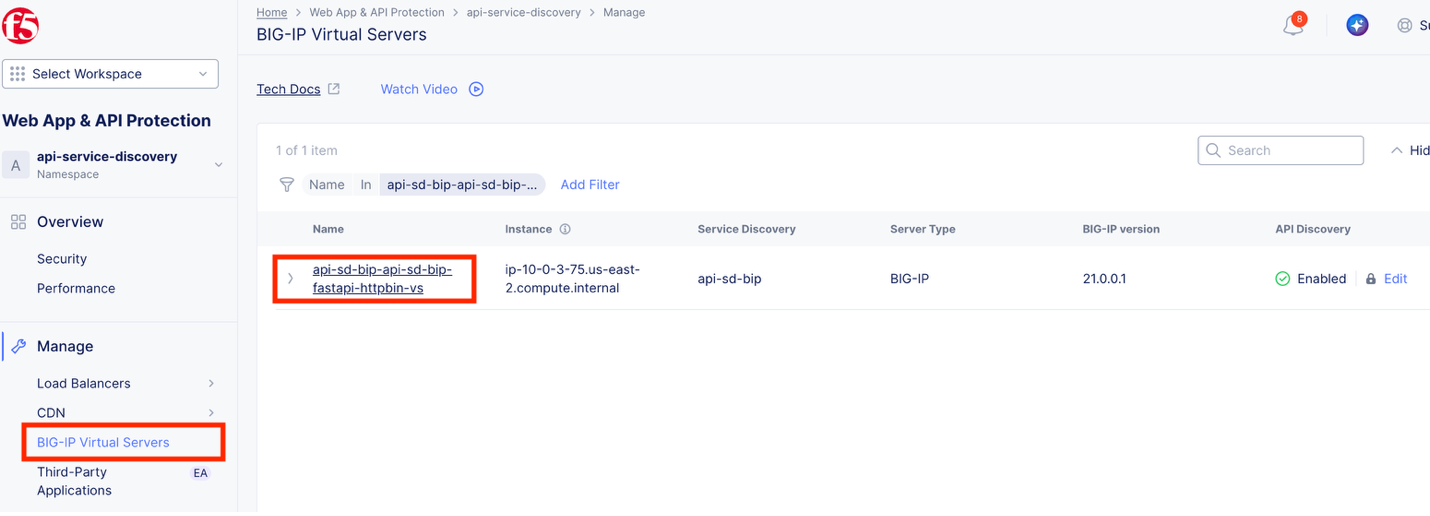
Click on the virtual server “api-sd-bip-api-sd-bip-fastapi-httpbin-vs” to view information about the service running on the BIG-IP. You should see the API Endpoints screen.
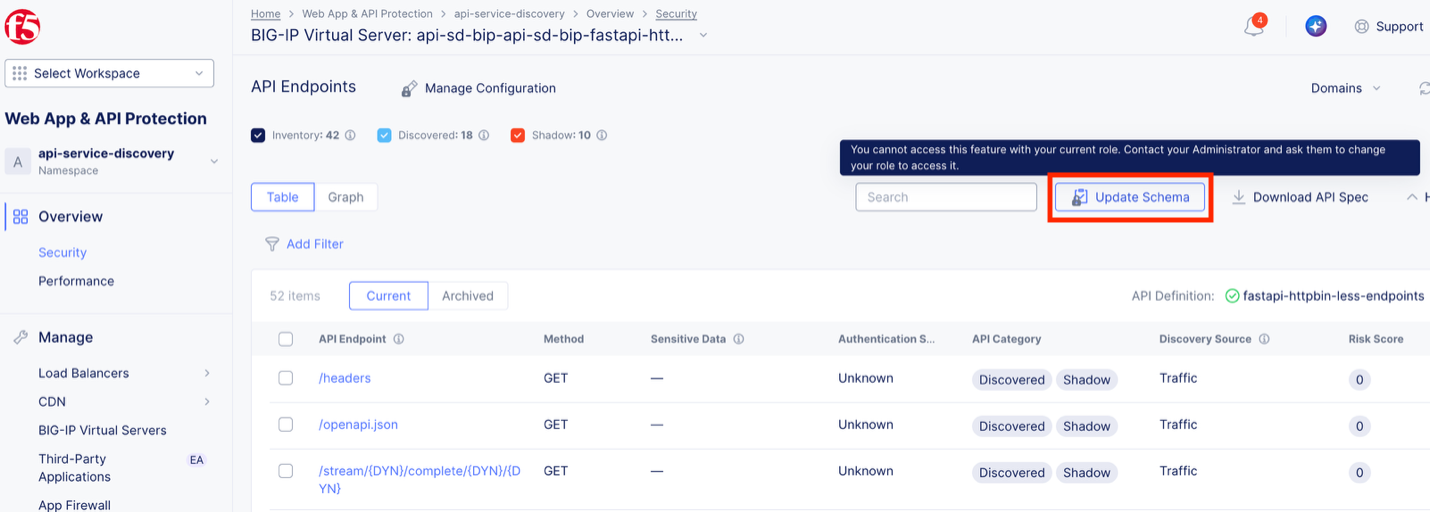
A primary concern for security engineers is identifying Shadow API endpoints. Click the checkbox next to “Inventory” to de-select the endpoints that are documented in a spec file. You should now only see “Discovered” endpoints.
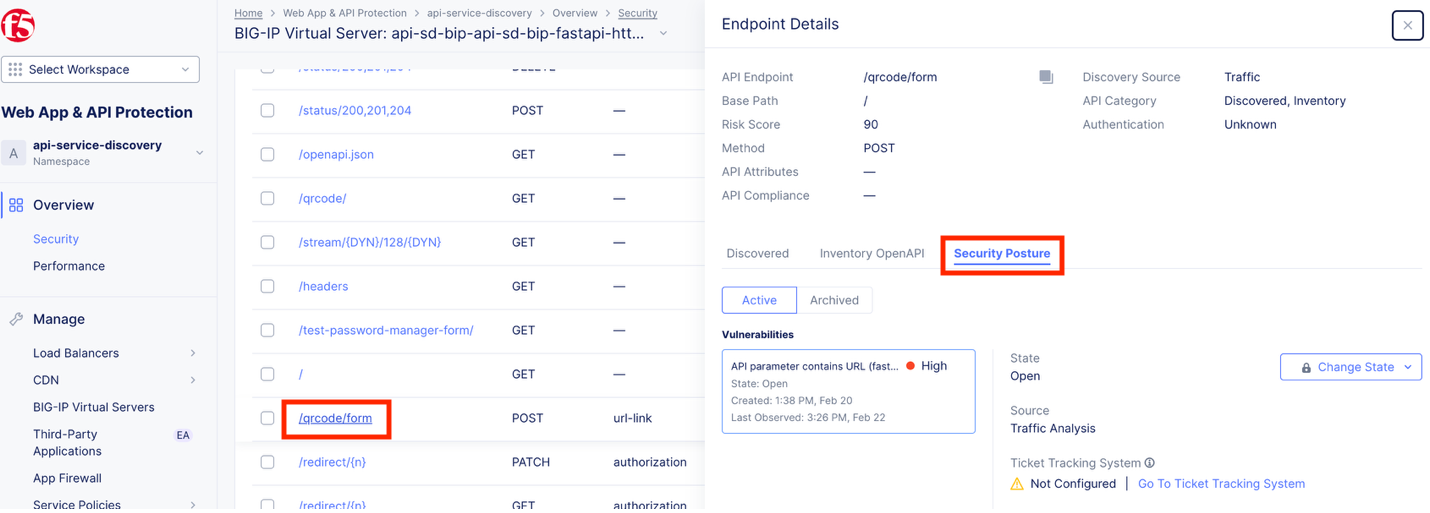
Two endpoints have a Risk Score of 90. Click on the “/qrcode/form” endpoint and on the new screen, click “Security Posture”. Why does this endpoint have a high risk score? Are there any steps that can be taken to reduce risk? This kind of analysis is exclusively available on Distributed Cloud and not something you can get natively in BIG-IP.
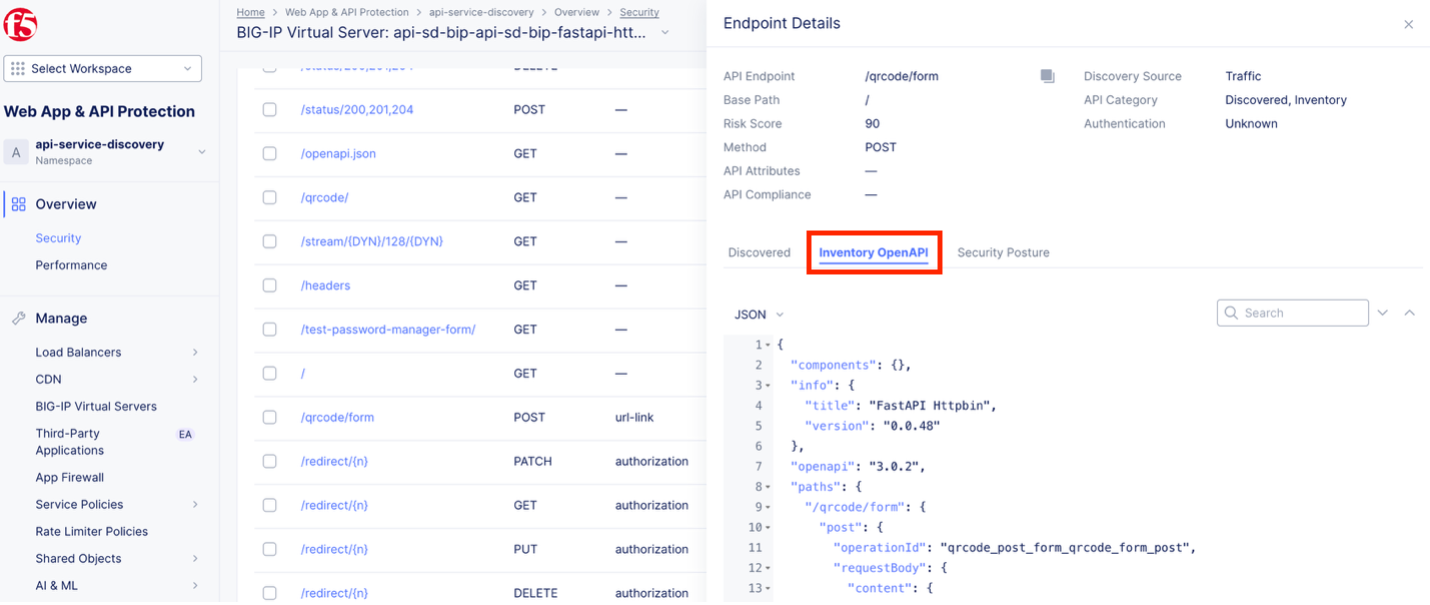
Click “Inventory OpenAPI” and view the spec file definition for this endpoint.
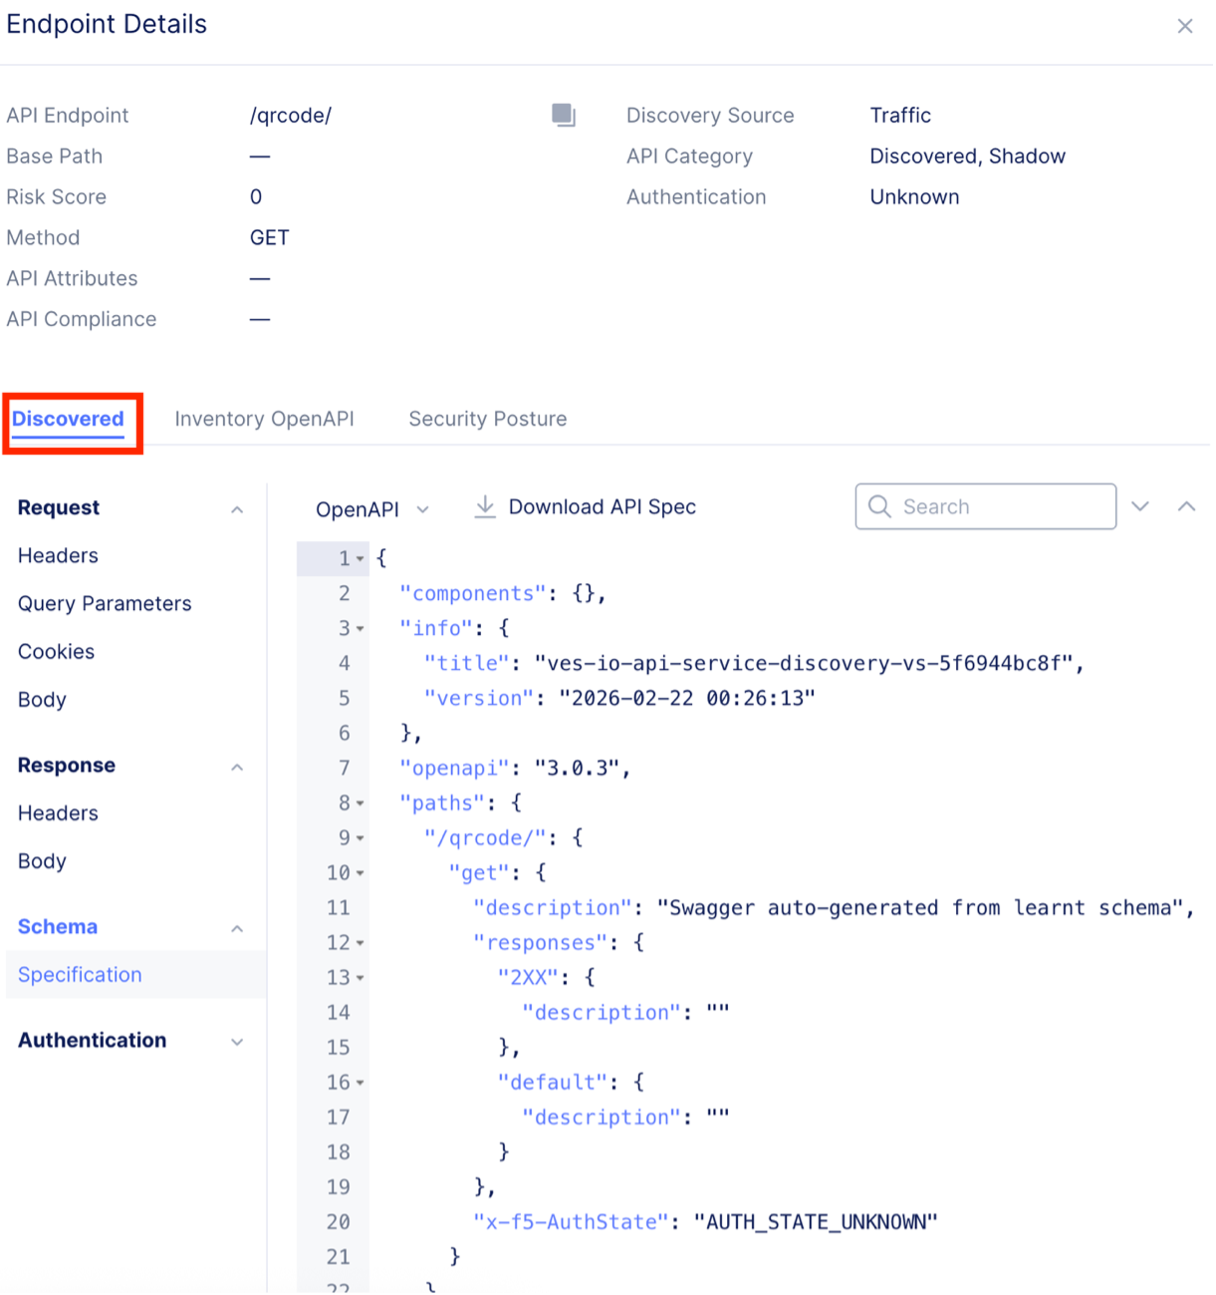
Click on any of the Shadow Endpoints (Example: /qrcode/ ) and review the endpoint details. Notice there is nothing published in the Inventory OpenAPI section (since this is a shadow endpoint, it is not defined in the API Spec file).
Click on the “Discovered” section and then Schema > Specification. This code is generated by Distributed Cloud when an endpoint is discovered. The more unique request/response telemetry observed, the more detailed this schema will become. But what if you want to update your spec file to include this endpoint?
Close out of the Endpoint Details screen and scroll up to see a button called “Update Schema”. We won’t be updating the schema as part of this lab, but this tool allows admins to reconcile differences between the existing API spec file and what XC has observed in real traffic. Admins can choose which endpoints are included in the updated schema along with any other mismatches observed.
Task 4: Review Performance and Logs
The BIG-IP connector ingests all kinds of telemetry, not just API endpoints. This task will review the health and request log for virtual servers running on your BIG-IP.
In the Overview section on the left, click on “Performance” and scroll to the bottom of the page and click the “fastapi-httpbin” load balancer. This is the virtual server running on the BIG-IP.
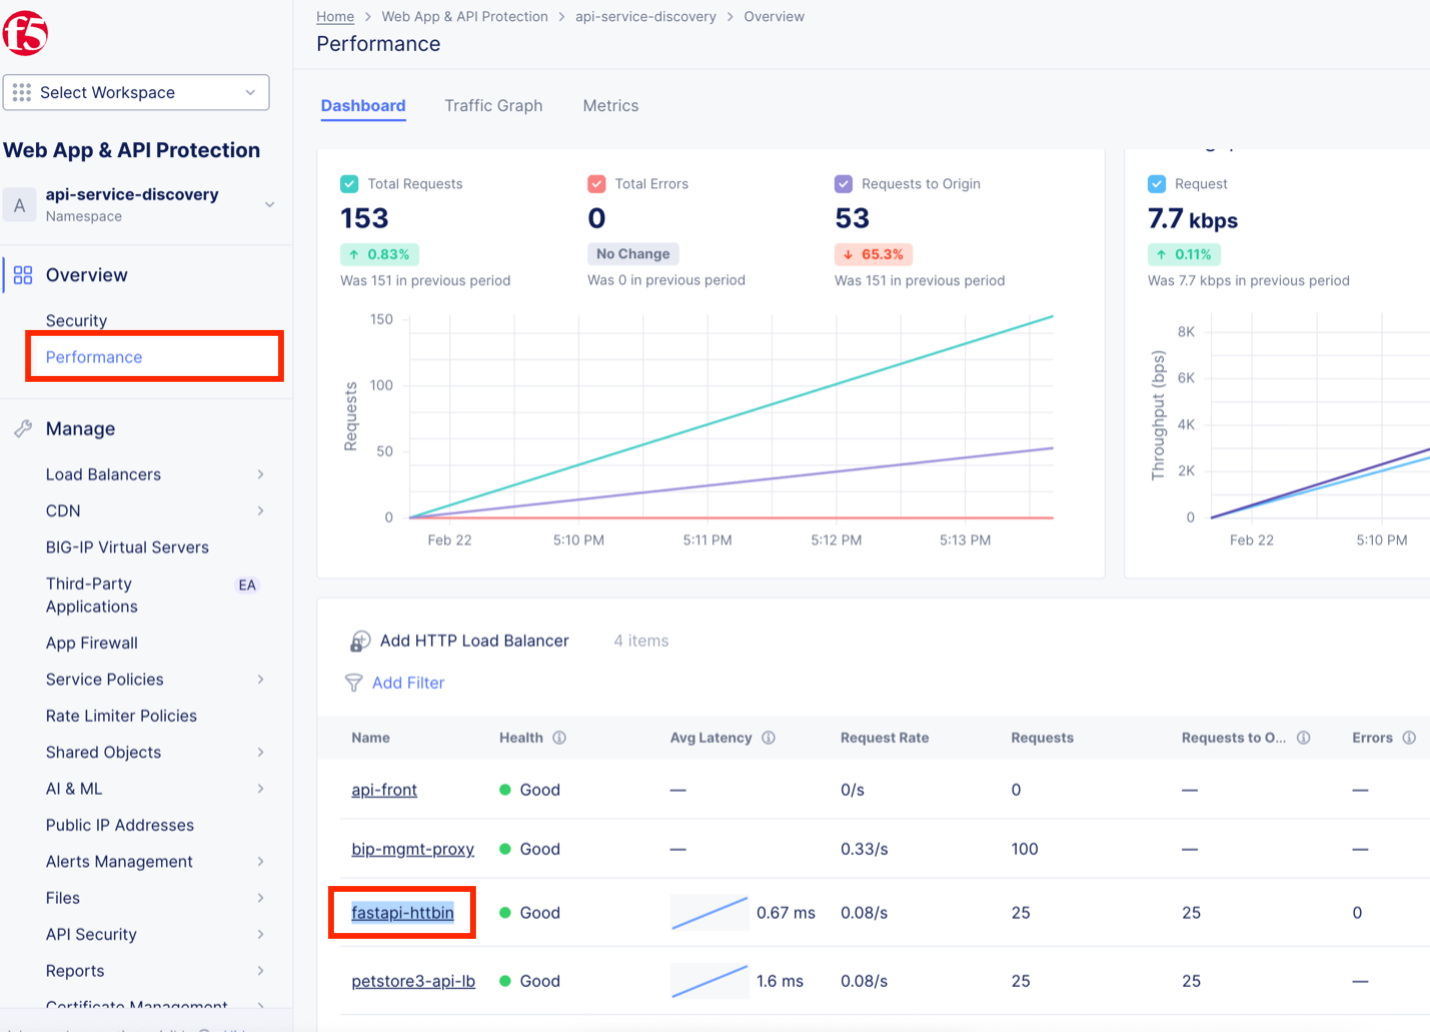
You now see the performance stats for fastapi-httpbin. Change the time interval to the last 1 hour and click Apply.
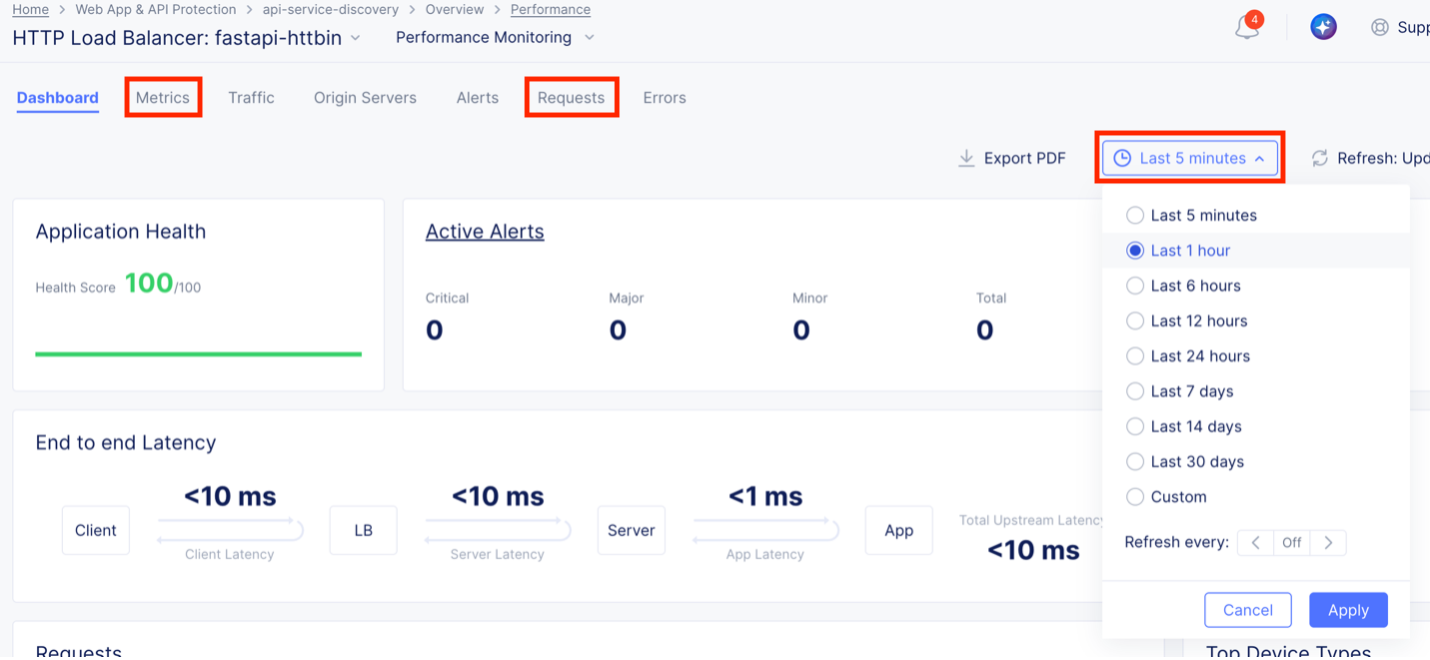
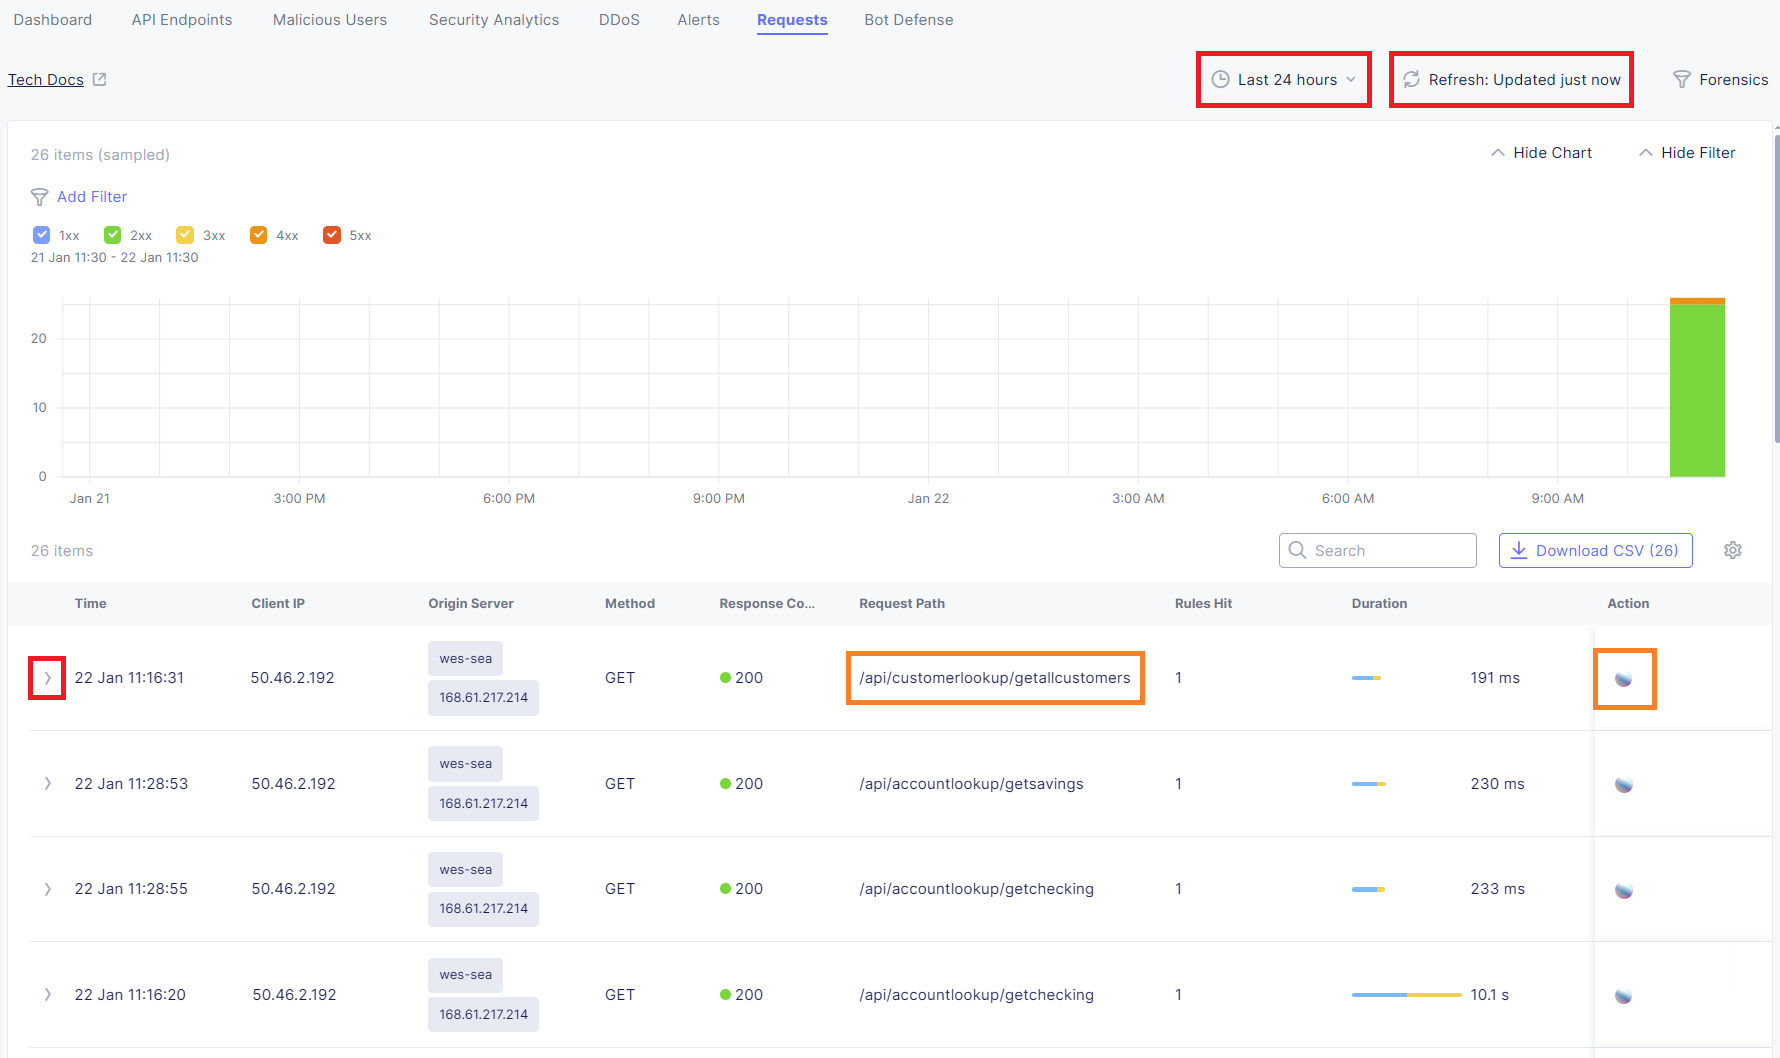
Review the Dashboard, Metrics, and Requests log and answer the following questions:
Which three API endpoints (Top URL) is requested the most? What is the average latency of this application? Which endpoint requests are resulting in a 307 Temporary Redirect error code?
Task 5: AI Assistant
From the Requests log, select any request with a 307 error and click the blue and white sphere under the Action column on the right side.
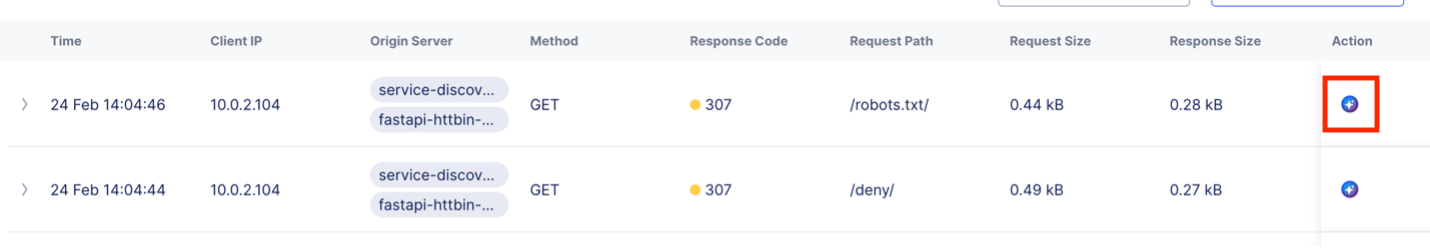
Review the AI Assistant Analysis. This powerful tool is another reason customers choose Distributed Cloud for API discovery.
End of Lab